Matlab basic exemples
We show here ho to generate a sine at a given frequency, and check its power spectrum. Then, we compare the spectrum of the sum of two sine at frequencies $f_1$ and $f_2$, and two consecutive sines at frequencies $f_1$ then $f_2$.
Clear everything
close all;clear;clc;
Generation of the first sine
We define the sampling frequency (in Hz) and the duration of the sine (in sec and in samples)
Fs = 10000; % in Hz
T = 0.1; % in sec
N = T*Fs; % in samples
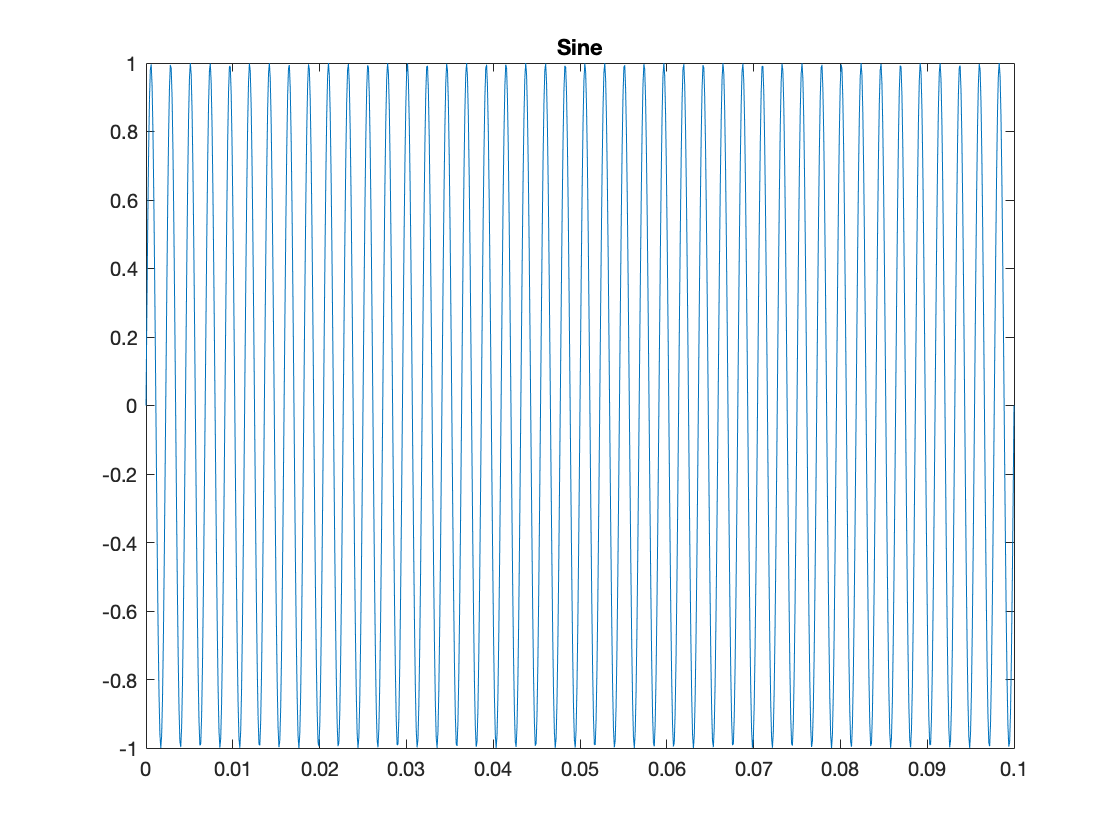
Creation of the sine: we generate the time vector and we chose a frequency
Time = linspace(0,T,N);
f1 = 440; % in Hz
x1 = sin(2*pi*f1*Time);

figure(1)
plot(Time,x1);
title('Sine')
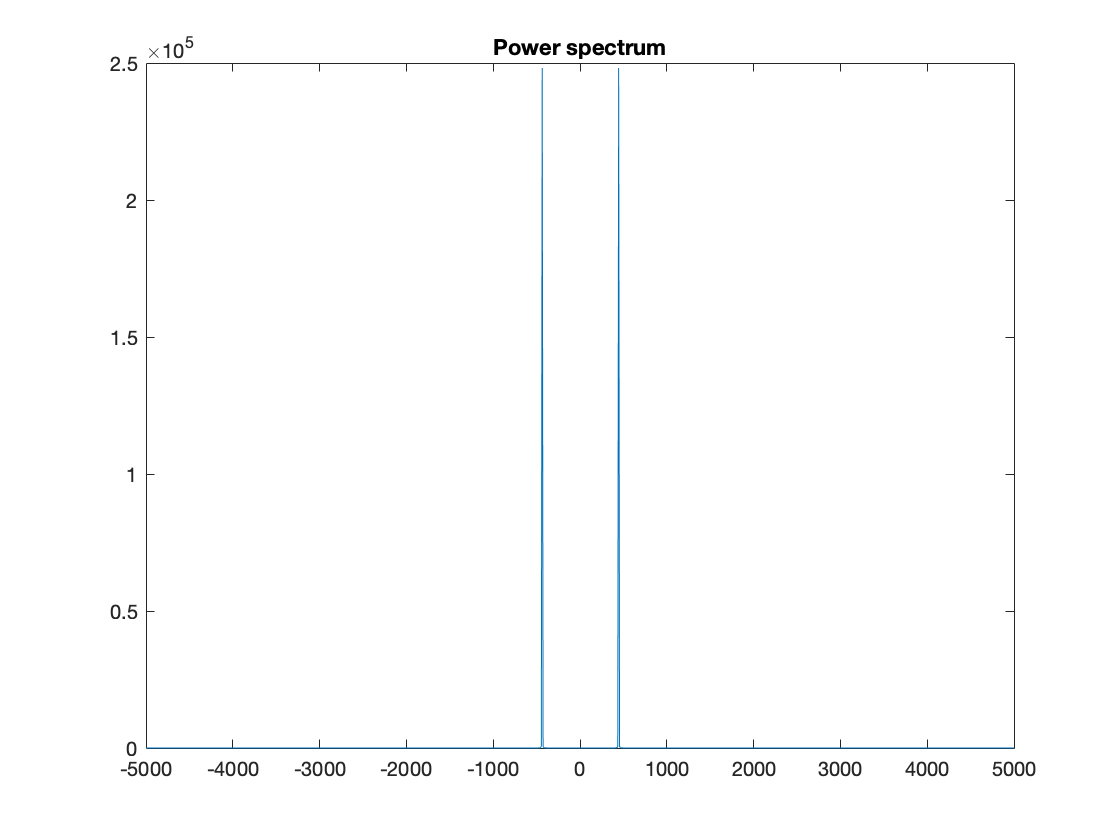
Spectral analysis
We generate the frequency axis and plot the power spectrum
Freq = linspace(-Fs/2,Fs/2,N);
x1_fft = fft(x1);
x1_spectrum = fftshift(abs(x1_fft).^2); % to get the 0 frequency in the middle

figure(2)
plot(Freq,x1_spectrum);
title('Power spectrum');
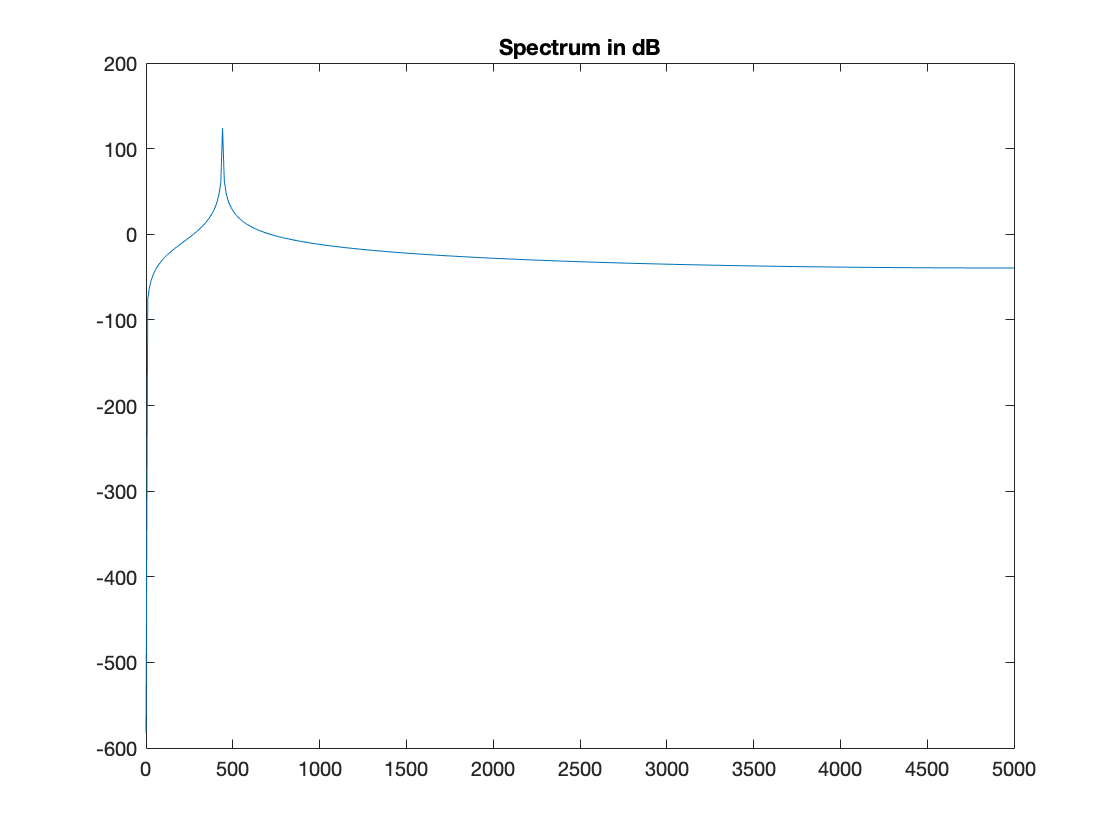
In practice we can plot only the positive frequencies, on a dB scale
x1_spectrum_db = 20*log(abs(x1_fft(1:round(N/2)))+eps);
Freq_pos = linspace(0,Fs/2,round(N/2));

figure(3)
plot(Freq_pos,x1_spectrum_db);
title('Spectrum in dB');
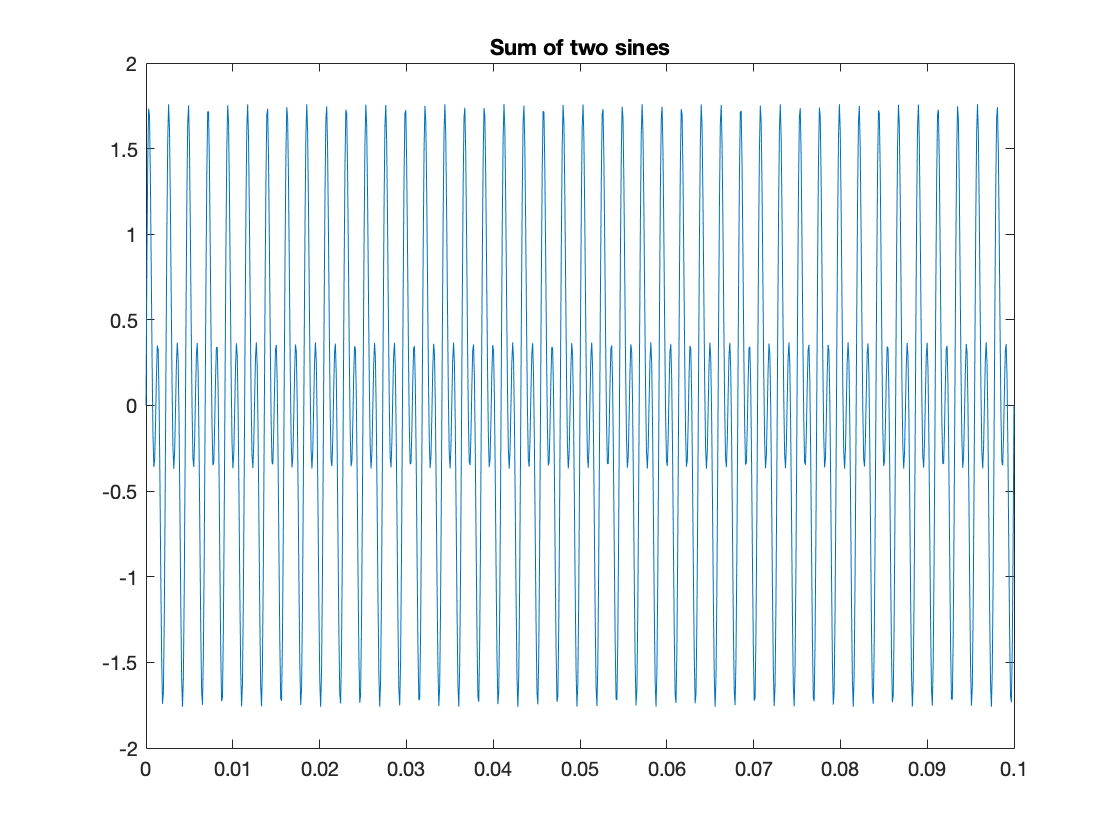
####Sum of two sines
generation of the second sine and the sum of the two sines
f2 = 880; % in Hz
x2 = sin(2*pi*f2*Time);
x3 = x1+x2;

figure(4)
plot(Time,x3);
title('Sum of two sines');
Spectral analysis
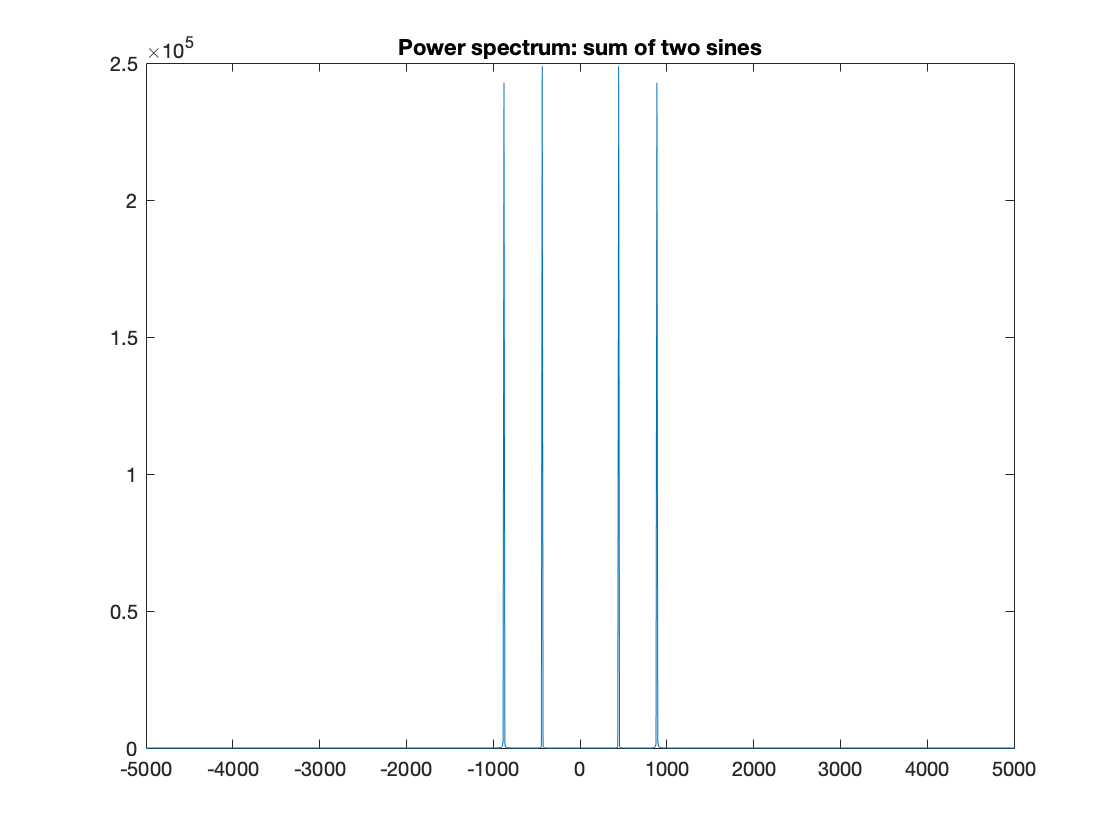
x3_fft = fft(x3);
x3_spectrum = fftshift(abs(x3_fft).^2);
figure(5)
plot(Freq,x3_spectrum);
title('Power spectrum: sum of two sines');
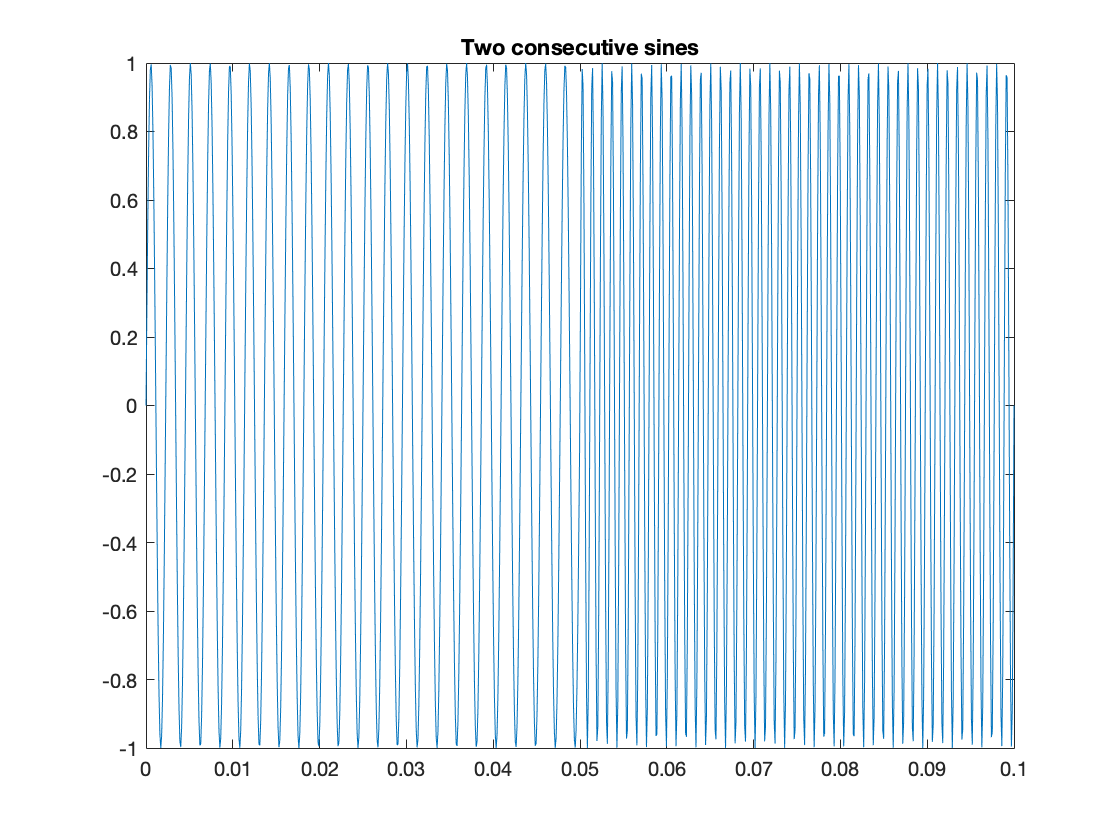
Two consecutive sines
generation of the signal
x4 = zeros(1,N);
x4(1:N/2) = x1(1:N/2);
x4(N/2+1:N) = x2(N/2+1:N);

figure(6)
plot(Time,x4);
title('Two consecutive sines');
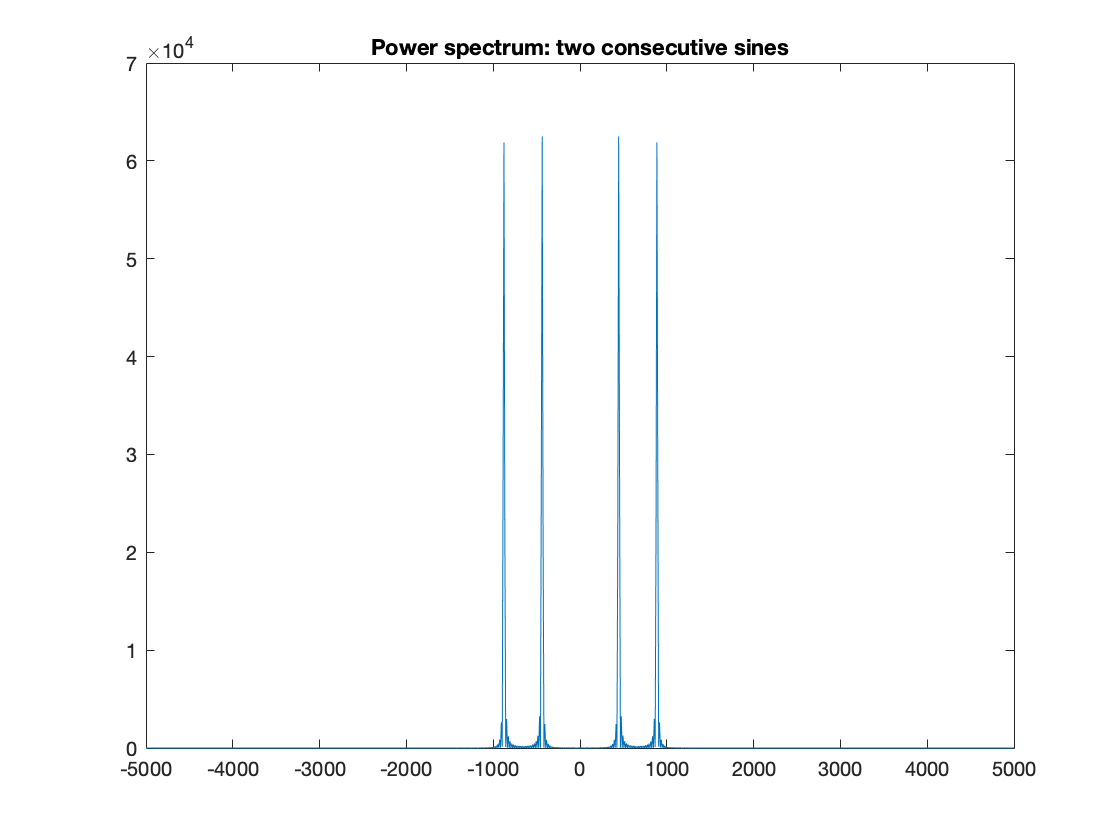
x4_fft = fft(x4);
x4_spectrum = fftshift(abs(x4_fft).^2);
figure(7)
plot(Freq,x4_spectrum);
title('Power spectrum: two consecutive sines');
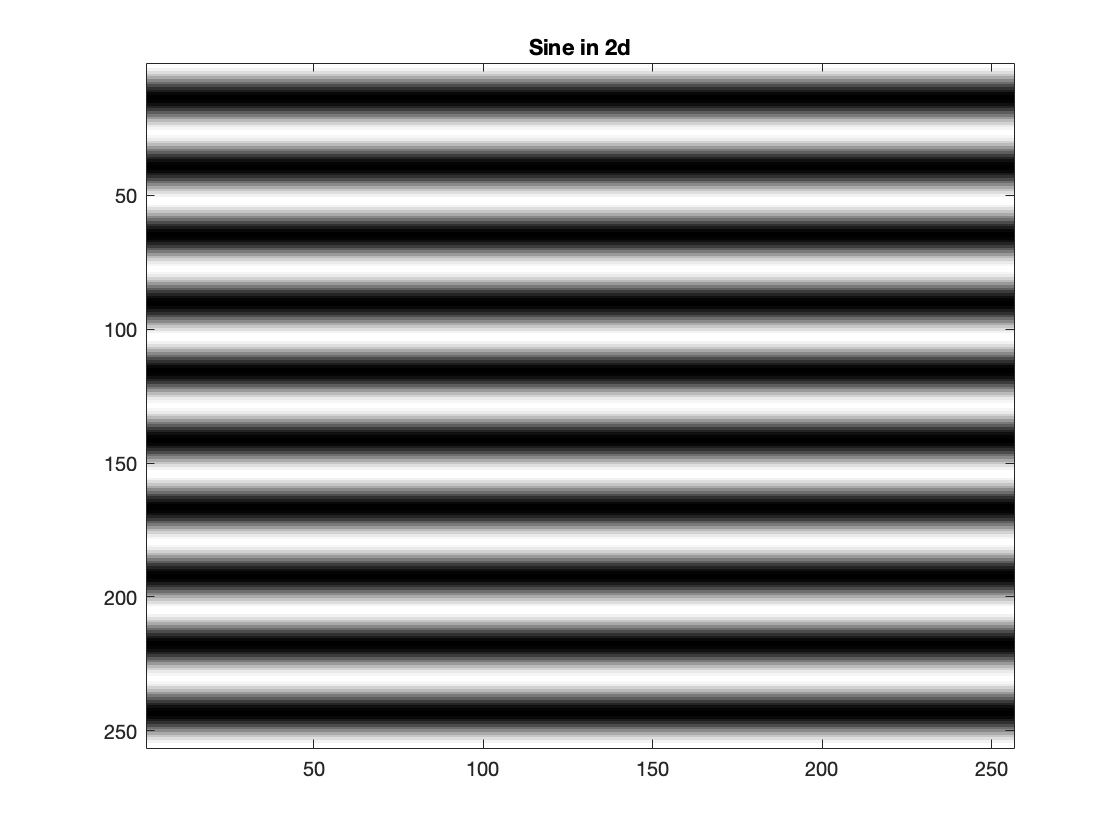
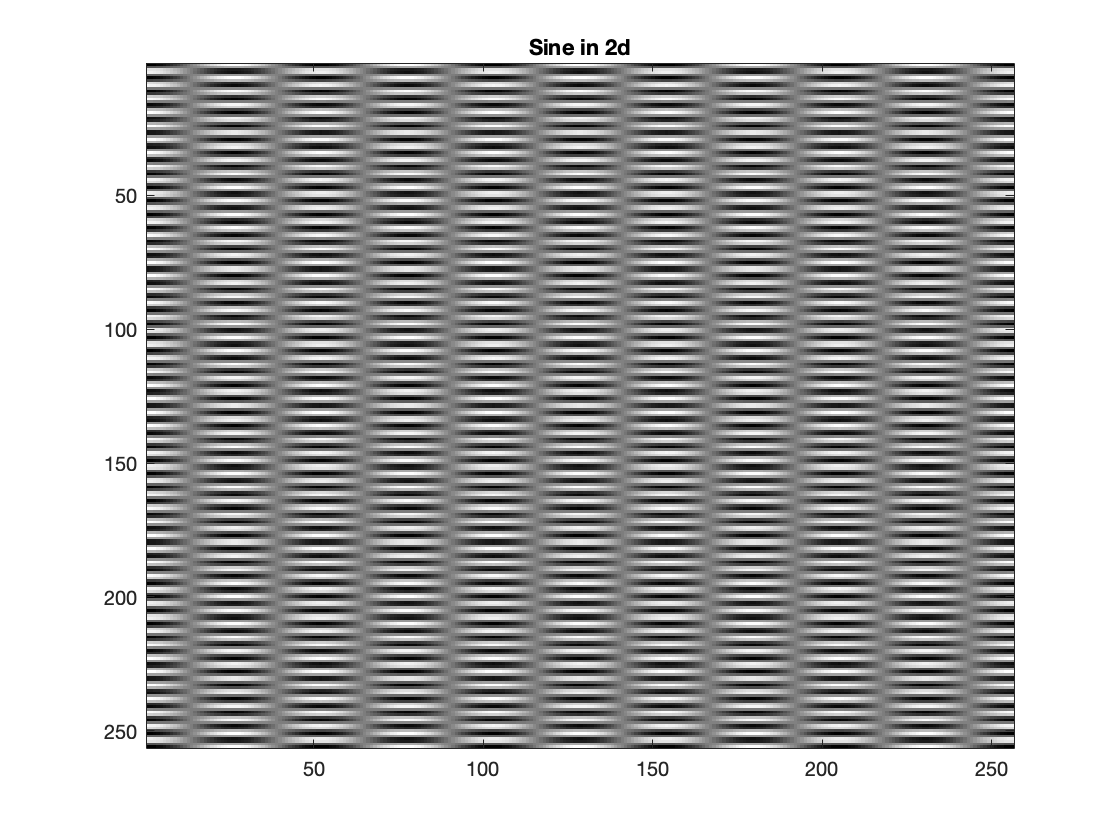
Sine in 2D
Generation of the sine in 2D. We chose the size of the image, the number of oscillation in the x direction and the number of oscillation in the y direction We first generate a sine in only one direction
N = 256; %Size of the image
I1 = zeros(N,N);


k1 = 0; %how many times you want wave to oscillate in x-dir
k2 = 10; %how many times you want wave to oscillate in y-dir
[X,Y] = meshgrid(linspace(-pi,pi,N));
Z = cos(k1*X).*cos(k2*Y);
plot the image
figure(8)
imagesc(Z)
colormap gray;
title('Sine in 2d');
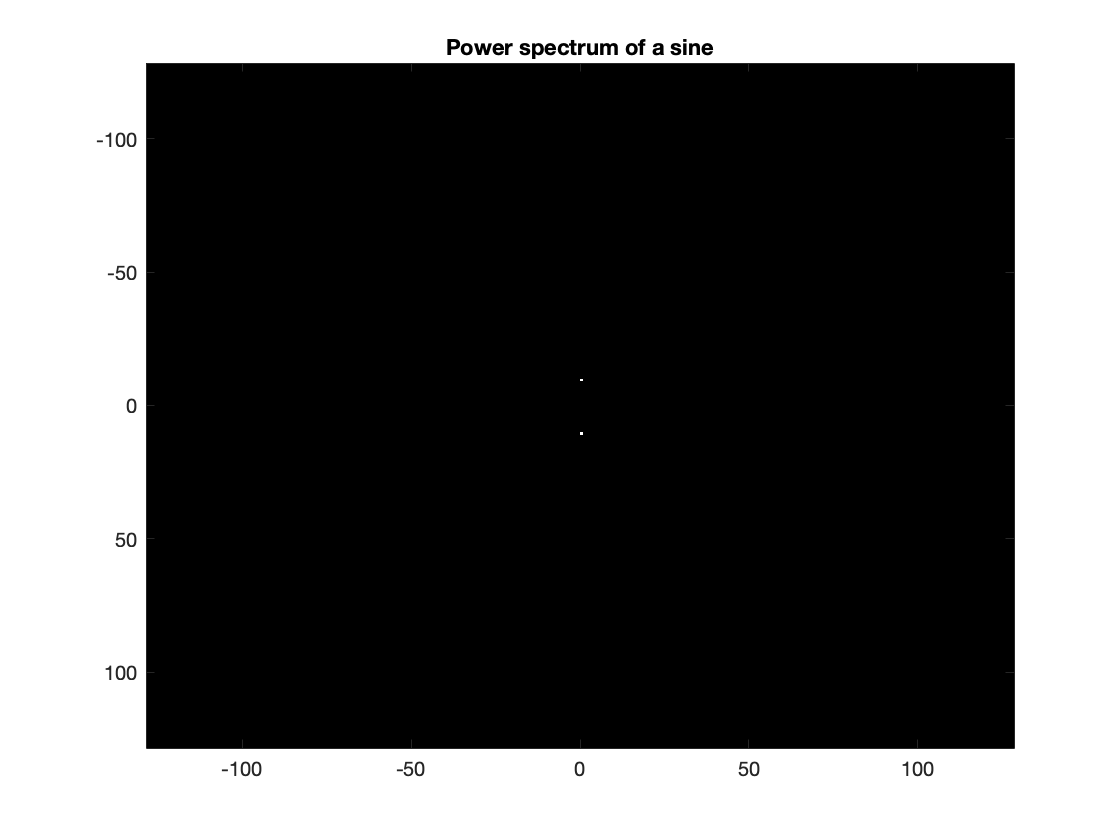
Perform the spectral analysis
Z_fft = fft2(Z);
Z_fft_spectrum = fftshift(abs(Z_fft).^2);

Freq = linspace(-N/2,N/2,N);
figure(9)
imagesc(Freq,Freq,Z_fft_spectrum)
colormap gray;
title('Power spectrum of a sine');
We now generate a sine in two directions
k1 = 5; %how many times you want wave to oscillate in x-dir
k2 = 50; %how many times you want wave to oscillate in y-dir
[X,Y] = meshgrid(linspace(-pi,pi,N));
Z = cos(k1*X).*cos(k2*Y);
plot the image
figure(10)
imagesc(Z)
colormap gray;
title('Sine in 2d');
Perform the spectral analysis
Z_fft = fft2(Z);
Z_fft_spectrum = fftshift(abs(Z_fft).^2);

figure(11)
Freq = linspace(-N/2,N/2,N);
imagesc(Freq,Freq,Z_fft_spectrum)
colormap gray;
title('Power spectrum of a sine');
